Logging & Monitoring
Observability
last9.io/blog/kubernetes-metrics-server/
Scalable and efficient source of container resource metrics for Kubernetes built-in autoscaling pipelines.
Core Idea
Metrics Server is the lightweight, in-memory source of CPU and memory numbers behind
kubectl topand the HPA; it is not a monitoring stack.
- It collects key usage data and serves it to the API server through the Metrics API: short-term, in-memory only, no long-term storage or complex queries.
- Division of labor: Metrics Server for real-time usage and autoscaling, kube-state-metrics for object metadata, Prometheus for long-term storage, queries, and alerting.
- Setup notes:
--kubelet-insecure-tlsworks around certificate problems, K3s ships it by default, and the HPA example holds CPU near 50%.
Intro
The Kubernetes Metrics Server collects key data like CPU and memory usage and shares it with the Kubernetes API server through the Metrics API.
- It’s a lightweight tool with short-term, in-memory metrics storage.
- It’s not built for storing metrics long-term or handling complex queries.
- It plays a critical role in autoscaling your workloads in Kubernetes.
Comparing with Other Solutions
- The Metrics Server is all about tracking real-time resource usage (like CPU and memory) for pods and nodes.which is essential for autoscaling.
- Kube State Metrics, on the other hand, focuses on the metadata of Kubernetes objects—things like the status of deployments, nodes, and pods.
- Prometheus, meanwhile, goes beyond that. It offers long-term storage, more advanced querying options, and alerting features, making it a go-to for more complex monitoring needs.
Setting Up the Metrics Server
If you’re running into TLS certificate problems, try using the --kubelet-insecure-tls flag.
apiVersion: v1
kind: ConfigMap
metadata:
  name: metrics-server-config
  namespace: kube-system
data:
  args:
    - --kubelet-insecure-tls
    - --kubelet-preferred-address-types=InternalIP
🌟 In K3s Metrics server available by default.
Accessing metrics server
kubectl top nodes
kubectl top pods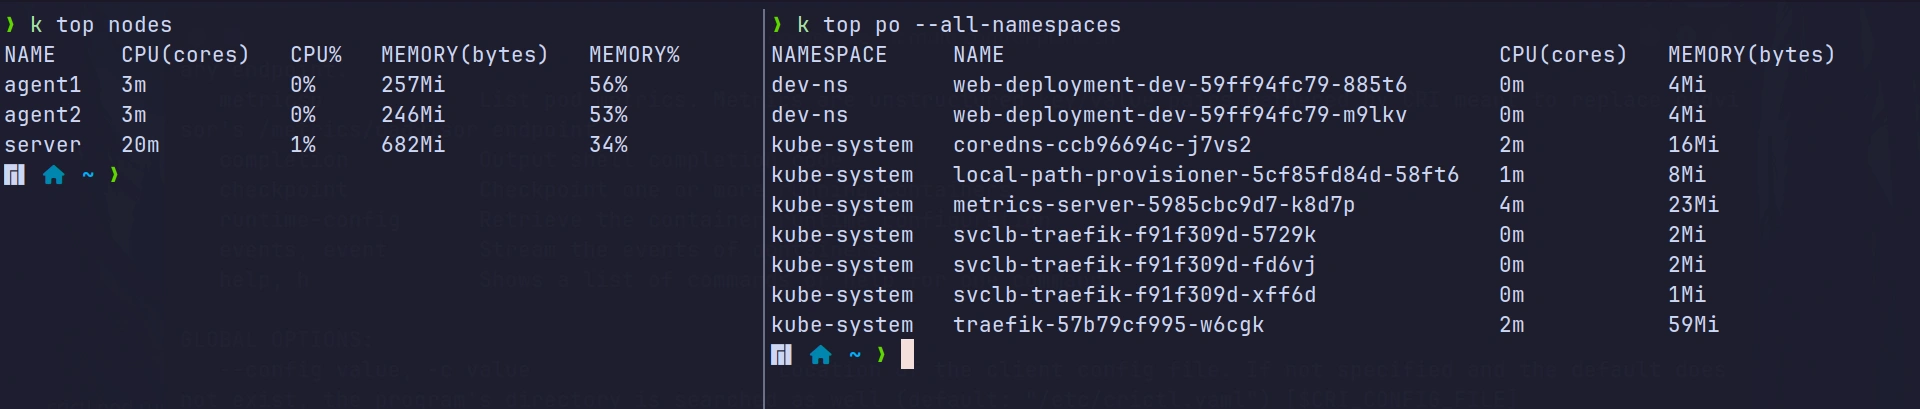
HPA
In this setup, the HPA adjusts the number of pods in the
php-apachedeployment to keep CPU utilization around 50%.
apiVersion: autoscaling/v2beta1
kind: HorizontalPodAutoscaler
metadata:
  name: php-apache
spec:
  scaleTargetRef:
    apiVersion: apps/v1
    kind: Deployment
    name: php-apache
  minReplicas: 1
  maxReplicas: 10
  metrics:
    - type: Resource
      resource:
        name: cpu
        targetAverageUtilization: 50