Core Idea
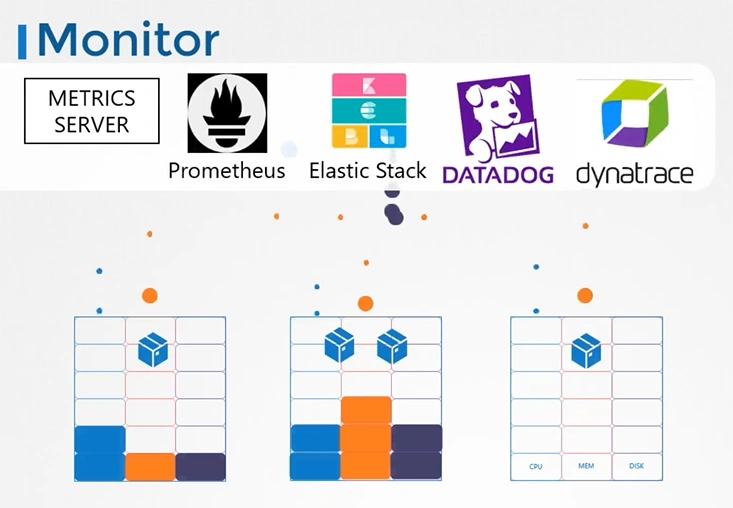
Monitor cluster components with Metrics Server (Heapster is the old way), and get application logs straight from the runtime, since Kubernetes keeps container logs locally on the node.
- Cluster monitoring: Metrics Server collects resource usage, set up with a ConfigMap (using
--kubelet-insecure-tlswhen certificates get in the way).- Application logs move from Docker-style log inspection to Kubernetes-native container logs you read per pod and container.
- The goal of monitoring is answered up front: watch resource consumption across the cluster.
Monitor Cluster Components
How do you monitor resource consumption in kubernetes? or more importantly, what would you like to monitor?
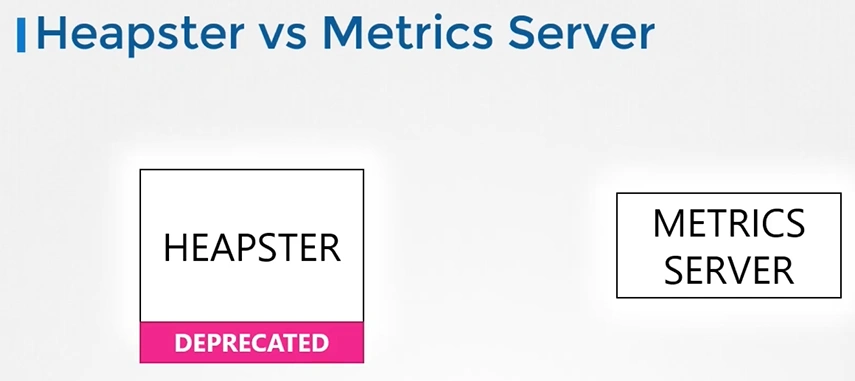
Heapster vs Metrics Server
- Heapster is now deprecated and a slimmed down version was formed known as the
metrics server.
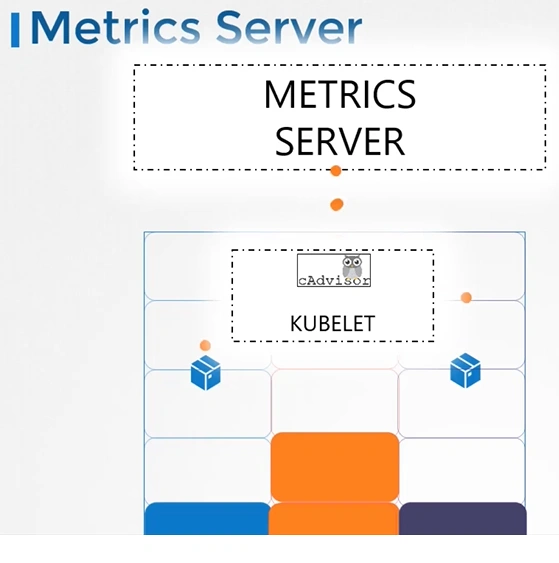
Metrics Server
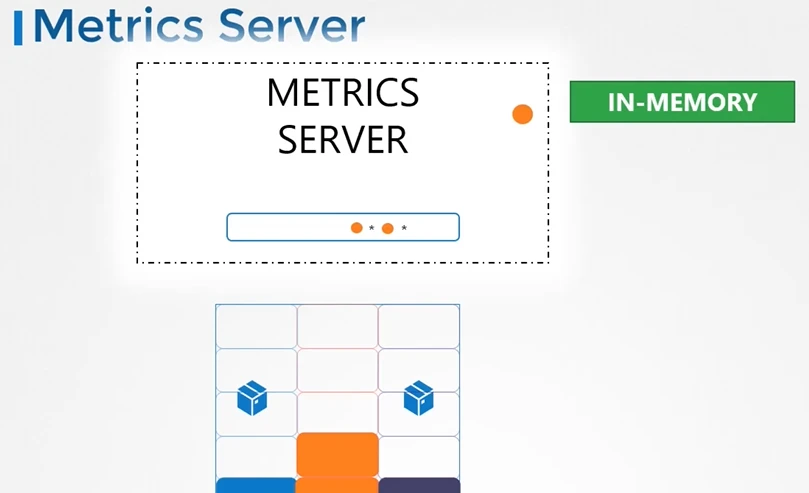
How are the metrics generated for the PODs on these nodes?
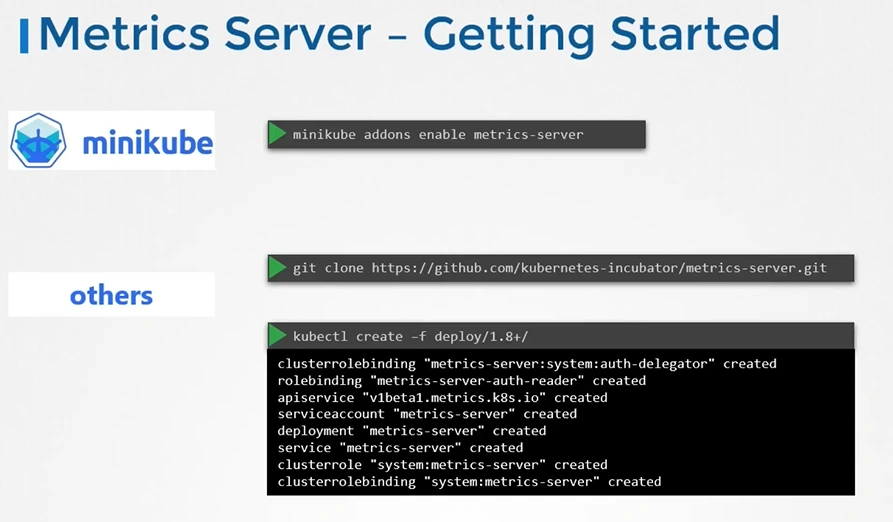
Metrics Server - Getting Started
-
Clone the metric server from github repo
$ git clone https://github.com/kubernetes-incubator/metrics-server.git -
Deploy the metric server
$ kubectl create -f metric-server/deploy/1.8+/ -
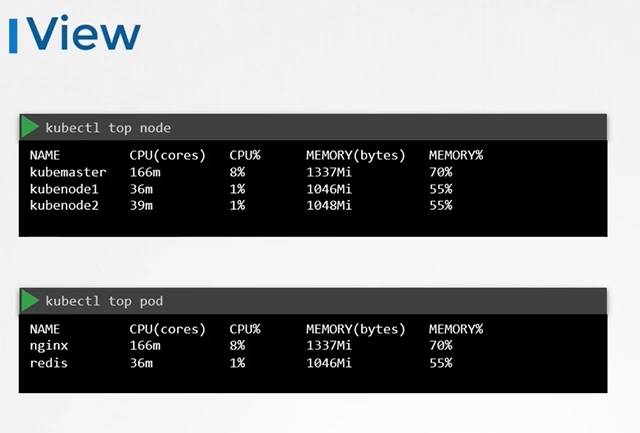
View the cluster performance
$ kubectl top node -
View performance metrics of pod
$ kubectl top pod
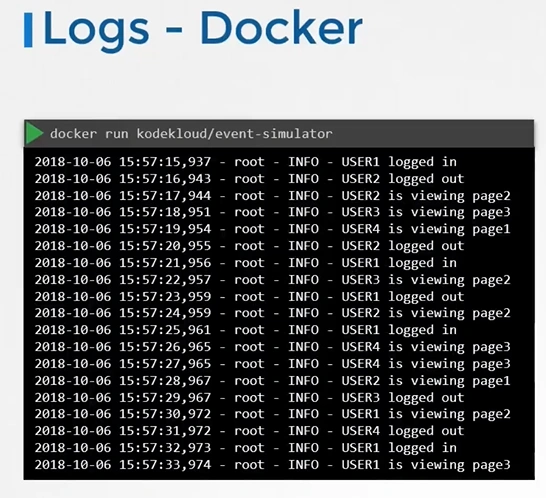
Managing Application Logs
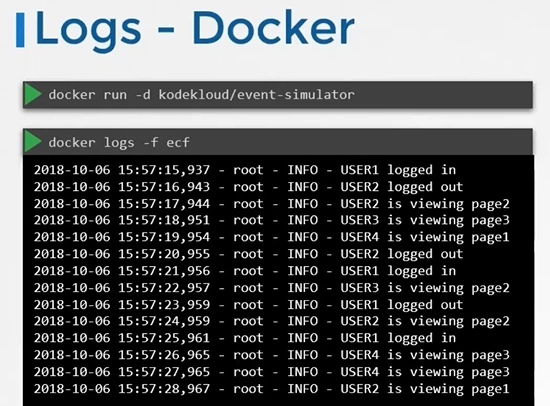
Let us start with logging in docker
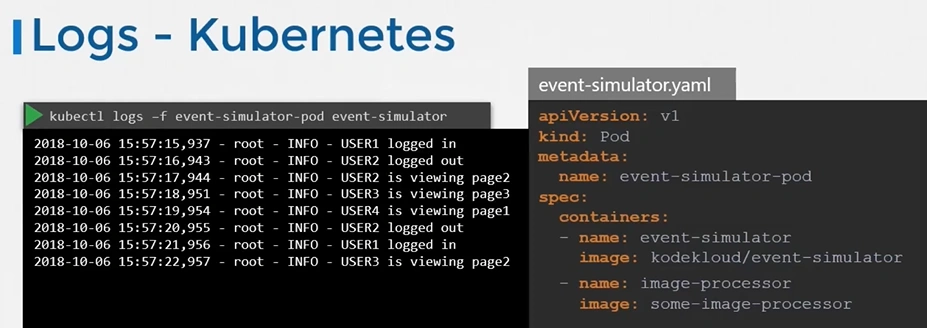
Logs - Kubernetes
apiVersion: v1
kind: Pod
metadata:
  name: event-simulator-pod
spec:
  containers:
  - name: event-simulator
    image: kodekloud/event-simulator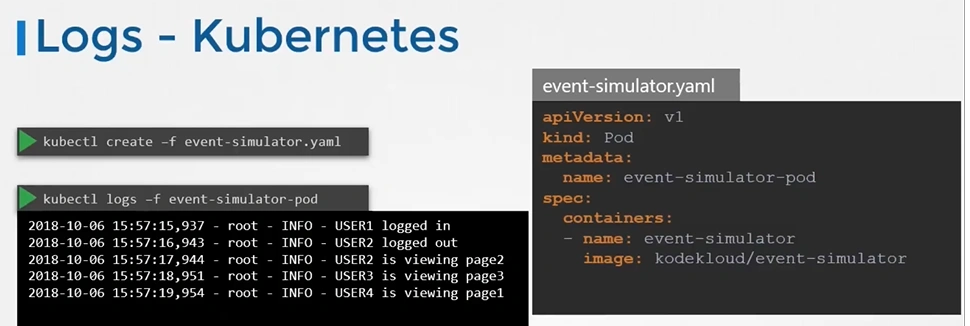
- To view the logs
$ kubectl logs -f event-simulator-pod - If there are multiple containers in a pod then you must specify the name of the container explicitly in the command.
$ kubectl logs -f <pod-name> <container-name>
$ kubectl logs -f even-simulator-pod event-simulator