devops/observability sitereliabilityengineering telemetry
What Is DevOps Observability? Benefits and Challenges
Fluentd | Open Source Data Collector | Unified Logging Layer
Quote
Observability is a system property that defines the degree to which the system can generate actionable insights. It allows users to understand a system’s state from these external outputs and take (corrective) action.
Observability | Cloud Native Glossary
Core Idea
Monitoring tells you that a system failed; observability lets you work out why, by reading the data the system already emits: logs, metrics, and traces.
- Monitoring checks the dashboard for known warning lights (low fuel, overheating). Observability is the full sensor suite you reach for when you don’t yet know what’s wrong.
- The three pillars: logs (event records in plain, structured, binary, or custom formats), metrics (numbers over time: CPU load, error counts, response times), and traces/spans (follow one request through a distributed system to find the bottleneck).
- Related: SLO, SLA and SLI for the targets you hold the system to, Prometheus Introduction for collecting metrics.
Intro
The literal meaning of Observability is the state of being observable.
In IT, Observability is defined as the ability to measure a system’s current state based on the output data (such as logs, metrics, and traces) it generates.
Monitoring vs Observability
Monitoring tells you that a system has failed, and Observability helps you find out why that system failed.
- Observability is like understanding a car by observing its performance through multiple sensors and logs, figuring out why it might not be running efficiently.
- Monitoring is like checking the dashboard for specific warning lights, such as low fuel or engine overheating.
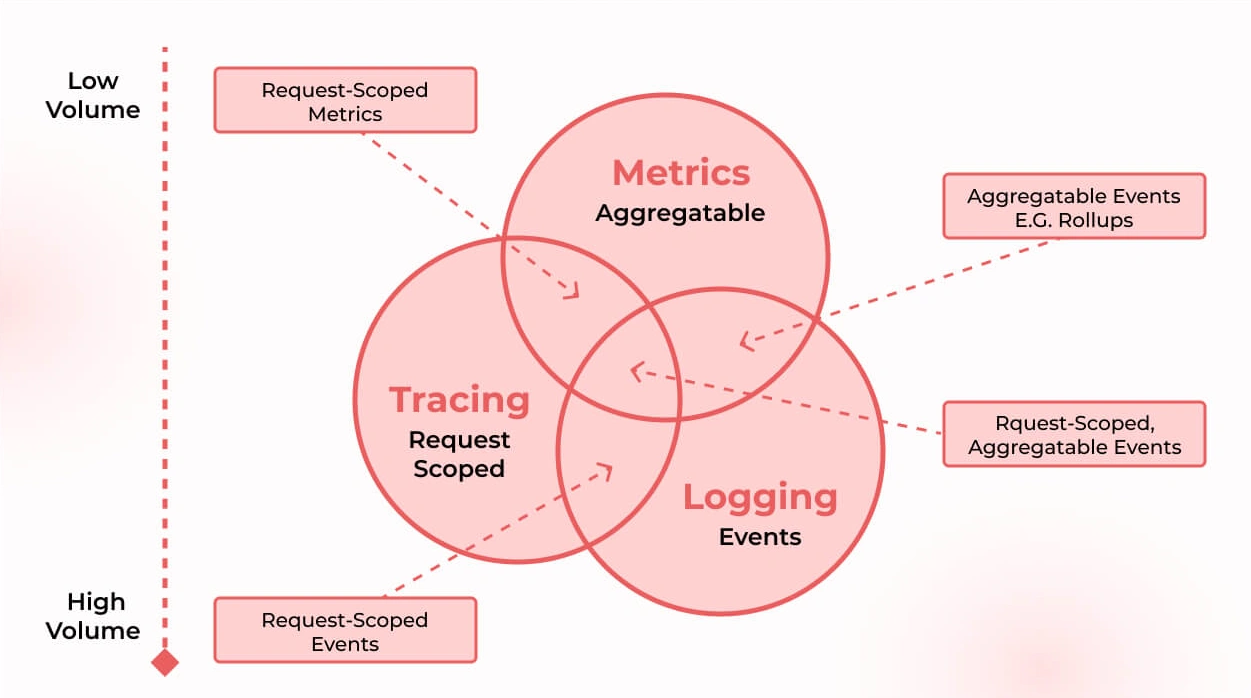
3 Pillars of Observability
- Metrics
- Logs
- Traces
1. Logs
A log is record of an event in your application.
A log entry usually contains information about the event that occurred, including a timestamp, event description, severity level, and sometimes additional context like user IDs or session IDs
Following are the few examples of different types of log formats.
- Plain Text: simplest form of logging in human readable text.
- Structured: Log entries structured in machine readable format (JSON, XML etc)
- Binary Format: Logs stored in binary format (Protobuf logs, MySQL Binary Logs, Systemd Journal Logs etc)
- Custom format: To serve specific project requirements.
2. Metrics
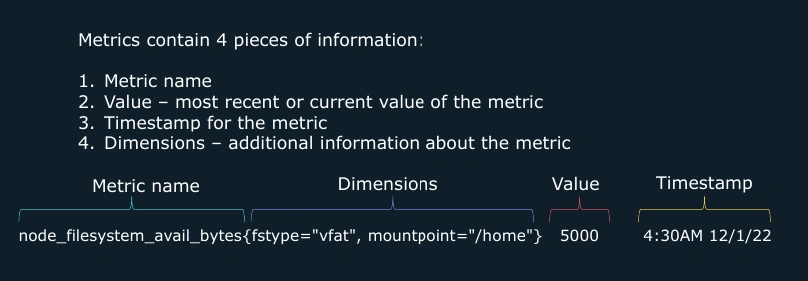
Metrics are data represented in numbers measured over a intervals of time
- CPU Load
- Number of open files
- HTTP response times
- Number of errors
3. Traces & Spans
“traces” and “spans” are terms primarily used in distributed tracing.
Distributed tracing is a method used to track and monitor the flow of requests through distributed systems, particularly in microservices architectures.
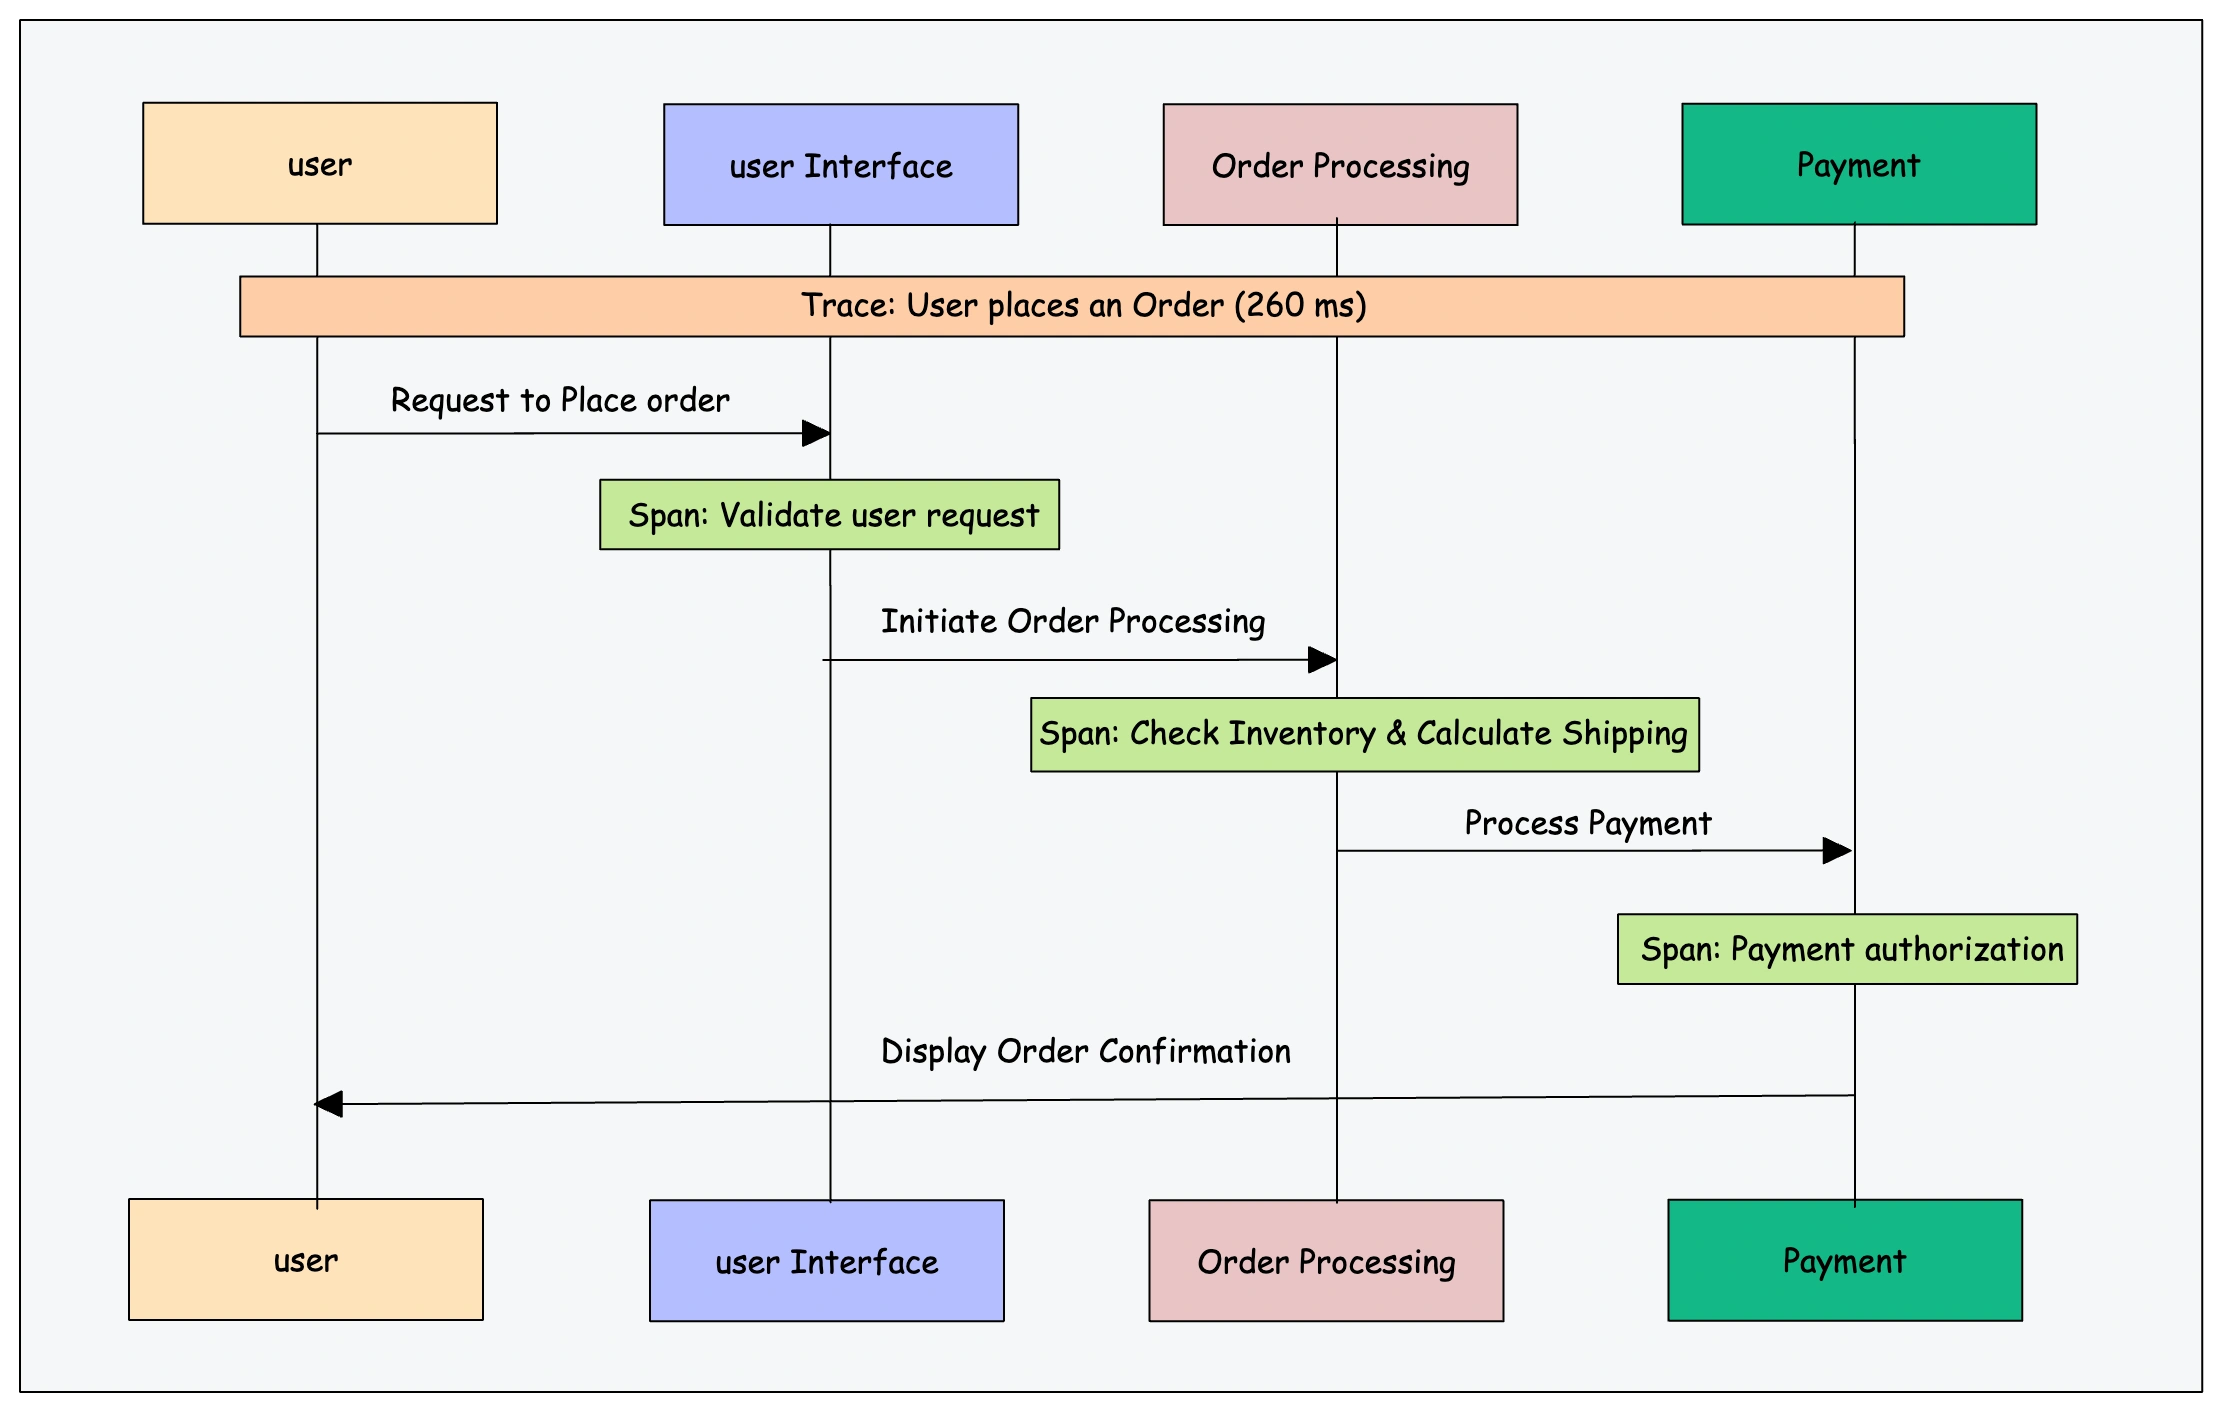
By analyzing traces, developers can identify bottlenecks, understand the impact of different components on the system’s performance, and troubleshoot issues.
Jaeger: open source, distributed tracing platform
Observability Related Topics
- SRE
- Prometheus