systemdesign systemdesign/concepts
Latency
Intro
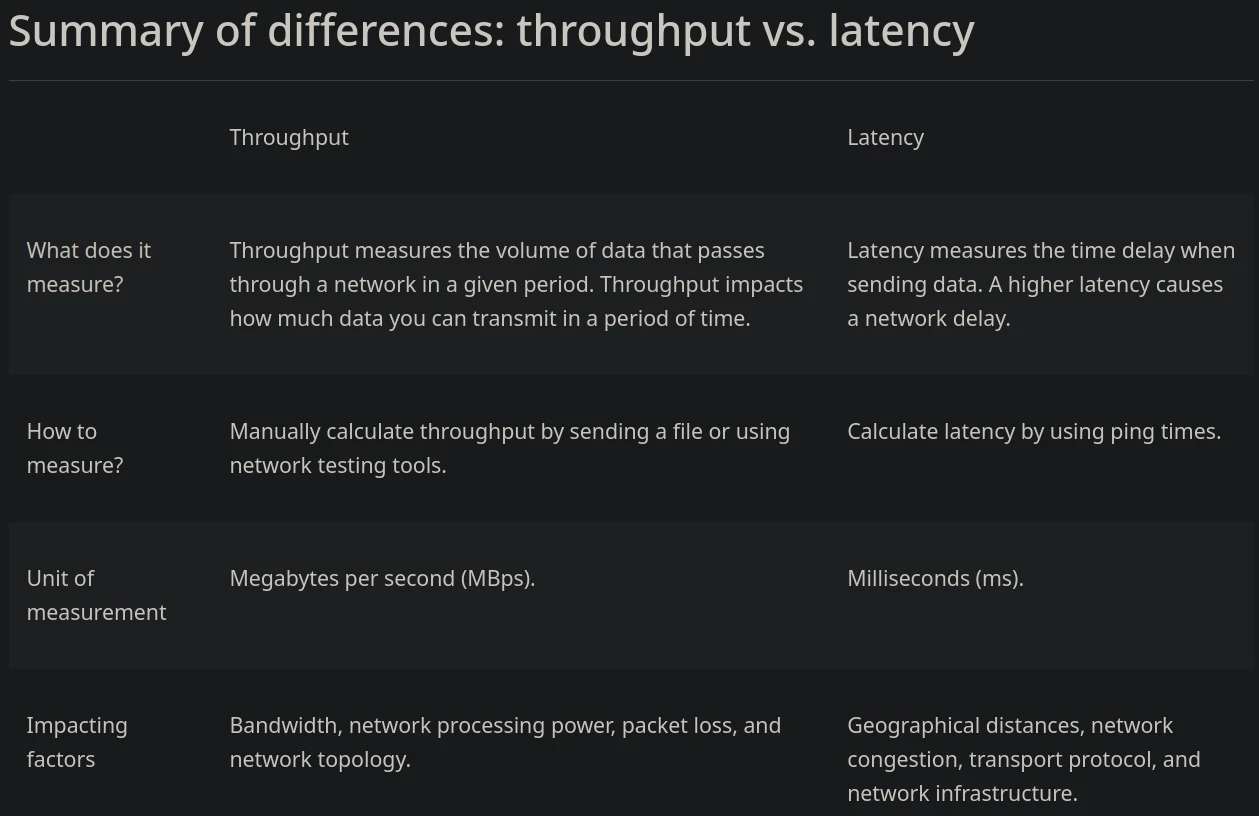
Latency is the time delay between the initiation of a request and the start of the response. In simpler terms, it’s how long it takes for data to travel from point A to point B and trigger a response.
-
Latency = Time taken from user request → system response
-
Includes:
- Client → Server (network latency)
- Server processing time
- Server → Client (response time)
-
Often used interchangeably with Performance, though strictly:
- Latency = Travel time of packets
- Performance = Overall response time
-
In networking: Latency is the time it takes for a data packet to go from your device to a server and back (also called round-trip time).
-
In web apps: It’s the delay between a user clicking a button and the server starting to respond.
-
In databases: Latency is how long a query takes before results start returning.
Types of Latency
| Type | Description |
|---|---|
| User-Facing Latency | Time taken to return a result to the end user (e.g., submitting a payment) |
| Internal Latency | Time between internal system components (e.g., logging system write) |
Latency Expectations by Use Case
| Application Type | Desired Latency |
|---|---|
| Food Delivery, E-commerce | Tens of ms → few seconds |
| High-Frequency Trading | Milliseconds |
Latency Optimization Techniques
| Technique | Description |
|---|---|
| Geolocation | Deploy services in data centers near users |
| Multi-region Deployment | Use multiple data centers for globally distributed users |
| CDN (Content Delivery Network) | Serve static content closer to users |
| Caching | Store frequent data in memory (e.g., Redis) to avoid recomputation |
| RPC over REST | Use RPC for smaller payloads and faster calls |
| Custom Protocols | Use Netty or similar frameworks with TCP/UDP instead of HTTP |
| Streaming/Batching | Stream large data or batch operations to reduce processing delays |
| Payload Minimization | Send only necessary data to reduce response size |
Trade-Offs to Consider
- Not every user request needs real-time data.
- Some responses can be acknowledgments (e.g., “Payment request received”).
- Actual processing can happen later (Event Driven or batch).
Throughput
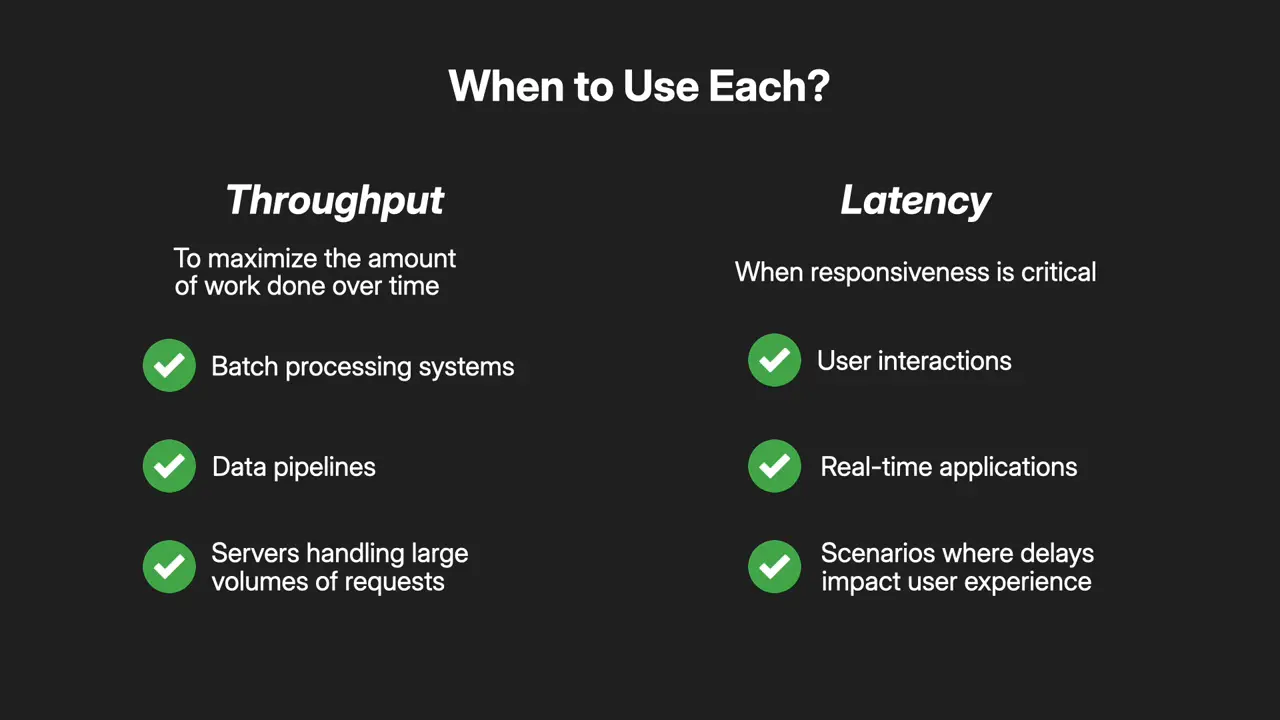
Throughput refers to the amount of data processed by the system in a given amount of time. Think of it as the speed at which work is done. For example, if a system can handle 1000 requests per second. Its throughput is 1000 req/sec.
Throughput and Latency are closely related.
- High Throughput, Low Latency: In an ideal world, we’d want systems with both high throughput and low latency. This would mean that the system can handle many requests quickly without delay.
- High Throughput, High Latency: Sometimes, to achieve high throughput, latency might increase. For instance, in a batch processing system where data is processed in large chunks, the system may handle a lot of data (high throughput), but the delay before results are returned (latency) might be longer.
- Low Throughput, Low Latency: Systems that prioritize quick responses might handle fewer requests at a time, leading to low throughput but lower latency.
Example
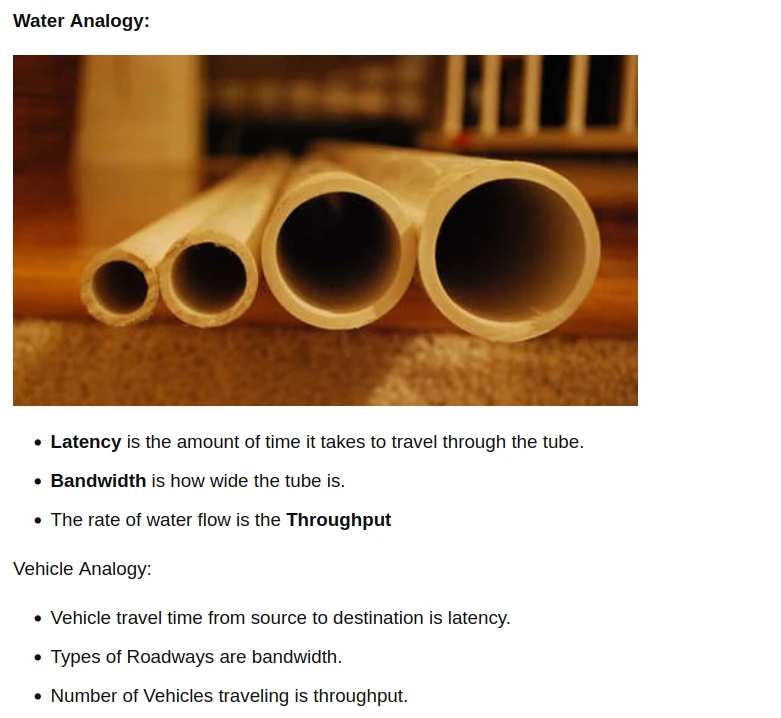
In AWS, latency is how long a request takes to reach a service (e.g., an EC2 instance in Sri Lanka calling API Gateway in another region). Bandwidth is the maximum capacity of the connection (e.g., the network bandwidth limit of an EC2 instance or EBS volume). Throughput is the actual data transferred per second, which depends on both latency and bandwidth, plus application and protocol limits.
Latency Metrics
P90 (90th Percentile)
- 90% of requests are faster than this
- Represents normal slow users
- Used to check baseline performance
AWS examples
- ALB TargetResponseTime p90 → most users see acceptable load time
- API Gateway latency p90 → typical API performance
- DynamoDB p90 → healthy partition access
Example
p90 = 120 ms → 9 out of 10 requests finish under 120 ms
P95 (95th Percentile)
- 95% of requests are faster than this
- Shows occasional slowness
- Common SLA / SLO metric
AWS examples
- CloudWatch Alarms on p95 latency
- RDS query latency p95 → identifies lock/contention issues
- Lambda duration p95 → near-worst normal executions
Example
p95 = 300 ms → only 5% of users experience slower responses
P99 (99th Percentile)
- 99% of requests are faster than this
- Captures tail latency
- Reveals real pain points
AWS examples
- Lambda cold starts → inflate p99 duration
- Cross-AZ or cross-region calls → spike p99
- DynamoDB hot partitions → extreme p99 latency
- Retries & throttling → p99 explodes even if p50 is fine
Example
p99 = 2.5 s → 1 in 100 requests is very slow
Latency Types
| Latency Type | What It Measures | Common Causes | Examples |
|---|---|---|---|
| Network Latency | Time to move data between systems | Distance, hops, congestion | Cross-region API calls, internet traffic |
| CPU Latency | Time waiting for CPU execution | High CPU usage, throttling, GC | Overloaded EC2, CPU-limited pod |
| Queue Latency | Time waiting in a queue | Traffic spikes, slow consumers | SQS message wait time, Kafka lag |
| Disk / IO Latency | Time to read/write storage | Slow disks, contention | EBS, RDS storage delays |
| Memory Latency | Time to access memory | Cache misses, swapping | RAM vs disk swap |
| Application Latency | Time spent in app logic | Inefficient code, blocking calls | Slow algorithms, serialization |
| Database Latency | Time to execute DB operations | Slow queries, locks | RDS query time, DynamoDB hot keys |
| Dependency Latency | Delay from external services | Slow APIs, retries | Payment gateways, third-party APIs |
| Cold Start Latency | Startup time before processing | Container/runtime initialization | Lambda cold start, pod startup |
| Serialization Latency | Time to encode/decode data | Large payloads, inefficient formats | JSON vs Protobuf |
| Cache Latency | Time to fetch from cache | Cache misses, network cache | Redis, Memcached |
| Tail Latency | Worst-case response time | Contention, retries, GC | p99 / p999 spikes |