devops/observability/prometheus sitereliabilityengineering telemetry
Core Idea
Prometheus has four metric types, and choosing the right one is the whole job: counter (only goes up), gauge (up and down), histogram (buckets), summary (precomputed quantiles).
- Counter counts cumulative events and resets on restart (
http_requests_total,errors_total). Gauge tracks values that fluctuate (memory, active connections, temperature).- Histogram sorts observations into buckets like
<1ms,<5ms,<10ms. Summary hands you quantiles such as p95 directly.- Custom metrics are defined in your own code with labels (the Go example counts
jobs_processed_totalby success/failure), and these measurements feed SLO, SLA and SLI.- Collection and querying live in Prometheus Introduction.
Intro
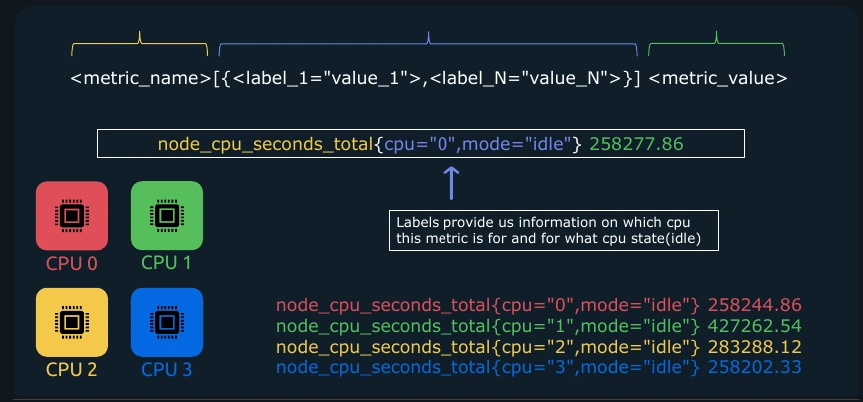
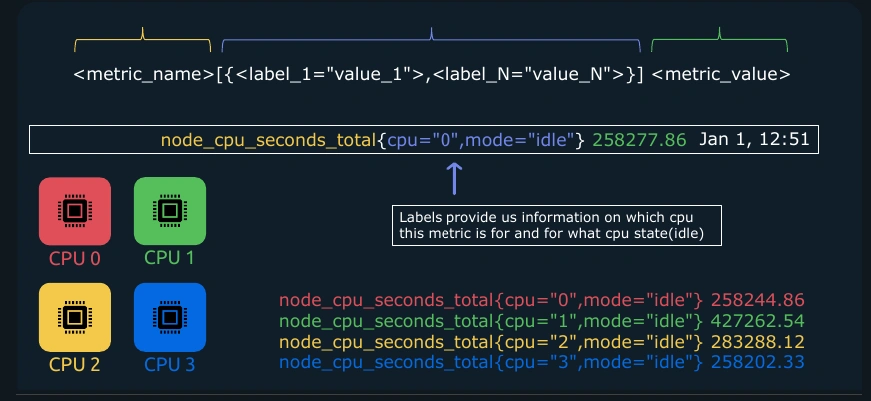
These metric types provide the measurements used by service-level objectives.
Timestamp
When Prometheus scrapes a target and retrieves metrics, it also stores the time at which the metric was scraped as well. The timestamp will look like this:
1668215300
This is called a unix timestamp, which is the number of seconds that have elapsed since Epoch(January 1st 1970 UTC).
Metrics Types
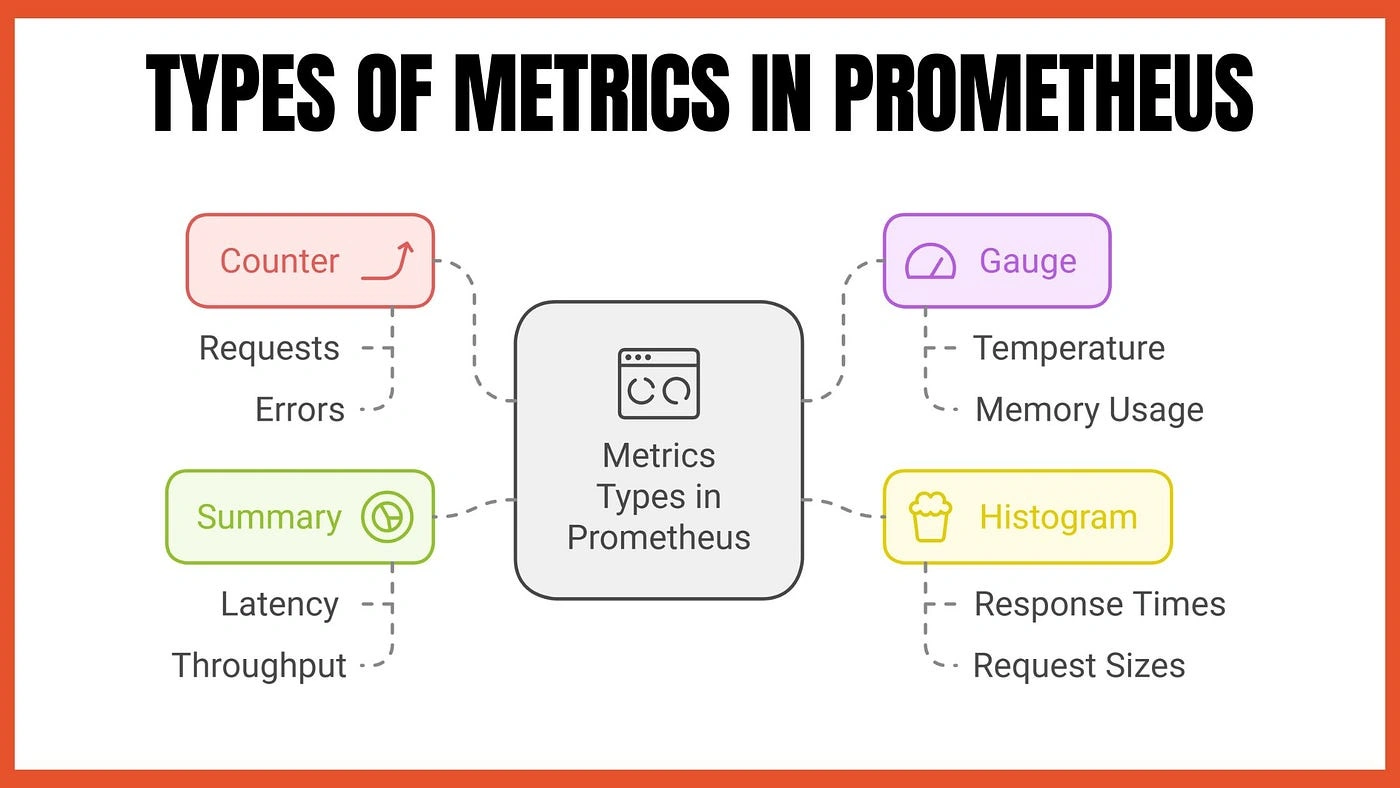
Understanding metric types | Prometheus
1. Counter
- Definition: A cumulative metric that only increases over time and resets to zero when restarted.
- Use Case: Tracks events or occurrences.
- Examples:
- Number of HTTP requests received (
http_requests_total). - Total errors encountered (
errors_total).
- Number of HTTP requests received (
2. Gauge
- Definition: A metric that represents a single value that can go up or down.
- Use Case: Tracks values that fluctuate over time.
- Examples:
- Current memory usage.
- Temperature readings.
- Active connections.
3. Histogram
- Definition: Measures the distribution of values over a set of predefined buckets.
- Use Case: Tracks the frequency of observed values falling into specific ranges.
- Examples:
- Request durations categorized into buckets (e.g.,
<1ms,<5ms,<10ms). - Response size distribution.
- Request durations categorized into buckets (e.g.,
4. Summary
- Definition: Similar to a histogram but provides precomputed quantiles (e.g., 90th percentile, 99th percentile).
- Use Case: Tracks percentiles of observed values and totals.
- Examples:
- Request durations with quantiles like 95th percentile.
- Latency distributions.
Comparison
| Metric Type | Behavior | Example |
|---|---|---|
| Counter | Only increases. | Total API requests. |
| Gauge | Goes up and down. | CPU usage, memory usage. |
| Histogram | Distributes values into buckets. | Request duration buckets. |
| Summary | Provides quantiles and totals. | 95th percentile of request latency. |
Custom Metrics
We can define custom metrics to monitor our application using metrics types.
// Counter Metrics
var jobsProcessed = prometheus.NewCounterVec(
	prometheus.CounterOpts{
		Name: "jobs_processed_total",
		Help: "Total number of jobs processed",
	},
	[]string{"status"}, // label for success/failure
)

func processJob(success bool) {
	if success {
		jobsProcessed.WithLabelValues("success").Inc()
	} else {
		jobsProcessed.WithLabelValues("failure").Inc()
	}
}