distributedsystem softwarearchitecture systemdesign
Intro
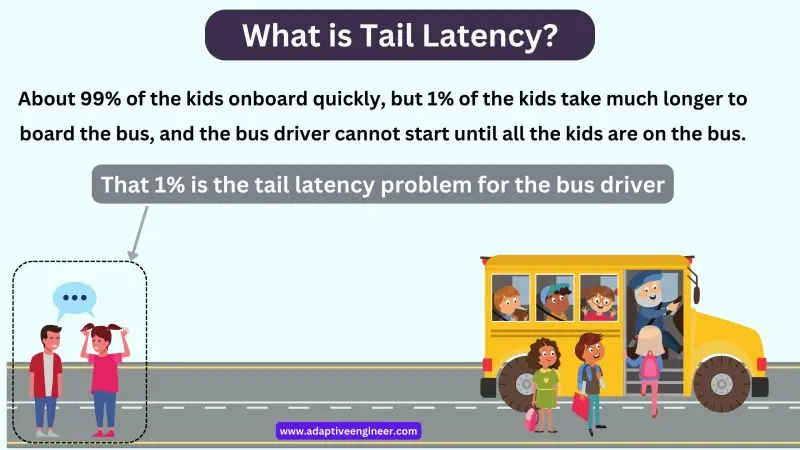
Tail latency refers to the worst-case response times experienced by a small percentage of requests in a distributed system. It is typically measured at high percentiles, such as the 95th, 99th, or even 99.9th percentile latency.
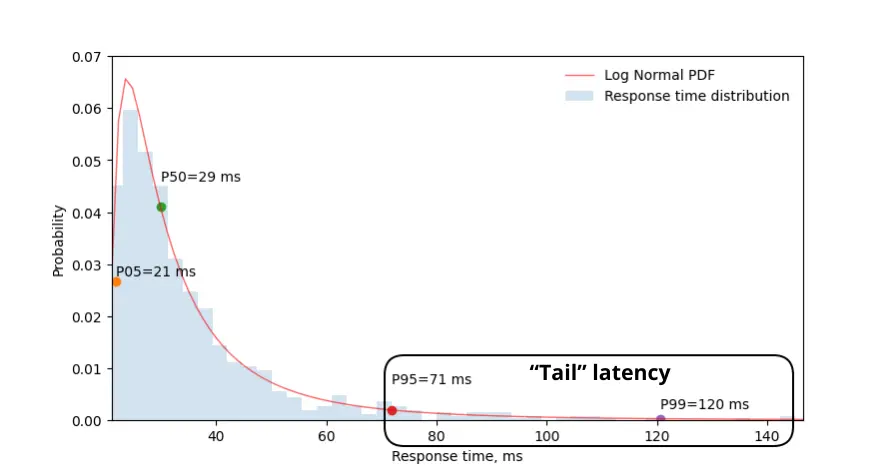
This group forms a long “tail” of requests with a very long response time. Such distribution’s tail we call
tail latency.
Why Is Tail Latency Important?
While the average latency might seem acceptable, a small fraction of requests could still experience significantly higher delays. These slow requests (in the “tail” of the latency distribution) can negatively impact system performance and user experience, especially in microservices architectures where multiple services interact.
Example
- Average latency: 100ms
- 95th percentile latency: 400ms (5% of requests take at least 400ms)
- 99th percentile latency: 1000ms (1% of requests take at least 1 second)
Even though the average response time is 100ms, the slowest 1% of requests could take 10x longer, causing timeouts, retries, and degraded performance for some users.
Causes of High Tail Latency
- Resource Contention: CPU, memory, disk, or network congestion.
- Garbage Collection (GC) Pauses: Especially in Java-based systems.
- Network Variability: Packet loss, jitter, or bandwidth fluctuations.
- Load Imbalance: Some servers handle more requests than others.
- Queueing Delays: Requests waiting for processing due to high load.
- Slow Dependencies: A database query or external API call taking longer than expected.
How to Reduce Tail Latency?
- Load Balancing: Distribute requests evenly across resources.
- Async Processing: Offload non-critical tasks to background jobs.
- Timeouts & Circuit Breakers: Prevent cascading failures (e.g., with Netflix Hystrix).
- Optimized Caching: Reduce repeated computations and database calls.
- Better Thread & Queue Management: Prevent resource starvation.
- Distributed Tracing & Monitoring: Use tools like Jaeger, Zipkin, Prometheus, and Grafana to analyze and fix latency bottlenecks.